Advisers Battle U.S. Investors' Home Bias As Valuations Soar
S&P 500 index is trading near all-time valuation highs; Japan and U.S. have the priciest stocks among major markets.
Bloomberg
July 26, 2017
American stock investors can’t get enough of the securities that offer some of the worst value for money, both geographically and historically.
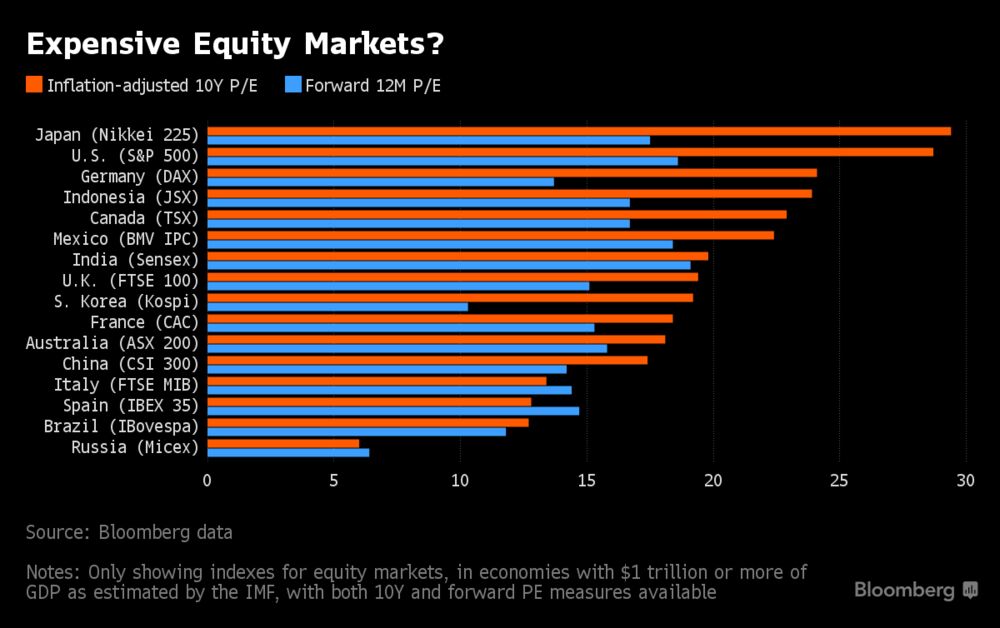
U.S. stocks have never been so expensive, aside from two brief periods before some of the biggest market crashes in history. This hasn’t hurt their popularity among U.S. investors, which tend to hold more domestic equities in their portfolio than investors elsewhere, according to a recent white paper by Vanguard.
The S&P 500 index’s cyclically adjusted price-to-earnings ratio of 28.7 trails only Japan among the economies with a gross domestic product of more than $1 trillion, and is tied for third among the 81 markets measured by Bloomberg as of June 30. The 10-year valuation metric is at a record high, aside for certain periods before the Great Depression of 1929 and the dot-com boom of 2000, Robert Shiller, the Nobel Prize-winning economist and the developer of the metric, said during a CNBC interview on June 29.
American stock investors can’t get enough of the securities that offer some of the worst value for money, both geographically and historically.
U.S. stocks have never been so expensive, aside from two brief periods before some of the biggest market crashes in history. This hasn’t hurt their popularity among U.S. investors, which tend to hold more domestic equities in their portfolio than investors elsewhere, according to a recent white paper by Vanguard.
The S&P 500 index’s cyclically adjusted price-to-earnings ratio of 28.7 trails only Japan among the economies with a gross domestic product of more than $1 trillion, and is tied for third among the 81 markets measured by Bloomberg as of June 30. The 10-year valuation metric is at a record high, aside for certain periods before the Great Depression of 1929 and the dot-com boom of 2000, Robert Shiller, the Nobel Prize-winning economist and the developer of the metric, said during a CNBC interview on June 29.
Diversifying globally is “very important” at current valuations to counter the “home country bias” that most U.S. investors exhibit, said Mebane Faber, co-founder and chief investment officer of Cambria Investment Management LP. “We recommend focusing on the cheapest quartile of stocks, which has a CAPE ratio half that of the expensive stocks, and about one third the valuation of the U.S.”
The price-earnings ratio -- or P/E for short -- says in the simplest sense how much one is paying for each dollar of profit generated by a company, or in this case, a country’s leading companies as a group. The CAPE ratio has been further fine-tuned from this foundation by Shiller, taking multi-year earnings into consideration to help iron out some of the more myopic and volatile aspects.
Some researchers argue the current levels are already past the critical stage. Valentin Dimitrov and Prem C. Jain wrote in a research paper last year that CAPE levels higher than 27.6, or in the upper half of the top decile, are associated with 10-year stock returns below those of 10-year Treasuries.
On the other end of the spectrum, Greece, Russia, Turkey and Pakistan are some of the world’s cheapest stock markets, reflecting political uncertainty and other risks involved.
Straight comparisons across markets can be deceiving, of course. U.S. stocks make up more than half of MSCI World Index’s weight, for example, which provides for a relatively high natural weight. Even so, U.S. investors invest 79 percent of their holdings in domestic equities, a higher proportion than any other major market in the world, according to the study by Vanguard, citing IMF data.
In comparison, Japanese and U.K. investors held 55 and 26 percent of equities holdings in locally-domiciled stocks, respectively, when each market made up for 7.2 percent of the global equities pool. Canadian investors held 59 percent of home stocks, while the local market accounted for only 3.4 percent of the global market.
Convincing investors to go global may require more than just the facts, with suitable presentation going a long way, according to Dan Egan, director of behavioral finance and investment at New York-based online investment adviser Betterment.
Visually breaking out allocations by country rather than asset class and focusing on how much earnings investors are buying with each dollar can “help them get more comfortable with overseas holdings, especially when U.S. markets are expensive,” Egan said. “Would investors rather spend $13 to buy $1 of earnings, or $5?”
Article Link To Bloomberg:
0 Response to "Advisers Battle U.S. Investors' Home Bias As Valuations Soar"
Post a Comment